about_
MY ROLE
UX/UI DESIGNER
TIMELINE
4 MONTHS
SKILLS/TOOLS
FIGMA, QUALITATIVE RESEARCH, GOV.BR DESIGN SYSTEMS
01 _ overview
A portal for all Brazil
The Ministry of Agriculture and Livestock Systems Portal serves as a national gateway. There is no single user profile, as the same portal is used by an artisanal fisherman in Pará seeking registration through PesqBrasil and by an administrative employee looking for the time-tracking system. More than 100 systems coexist on a single page without any categorization, search functionality, or even alphabetical organization.
100+
Systems cataloged in the database.
3
Ministries served (MAPA, MDA, and MPA)
A user base composed of diverse audiences.
02 _ the problem
Even if you know what you're looking for, finding it is difficult
By analyzing the user flow, we found that even users who knew exactly which system they needed were often unable to locate it. The list was overwhelming, with no apparent logical structure. Inactive systems were mixed with active ones, and outdated contact information pointed to people who no longer worked at the ministry. The result? Wasted time, increased support requests due to access issues, and frustration, especially for users with limited digital literacy.
How might we reorganize more than 100 systems within a national access portal so that any user, regardless of their profile, can find what they need in under 30 seconds?
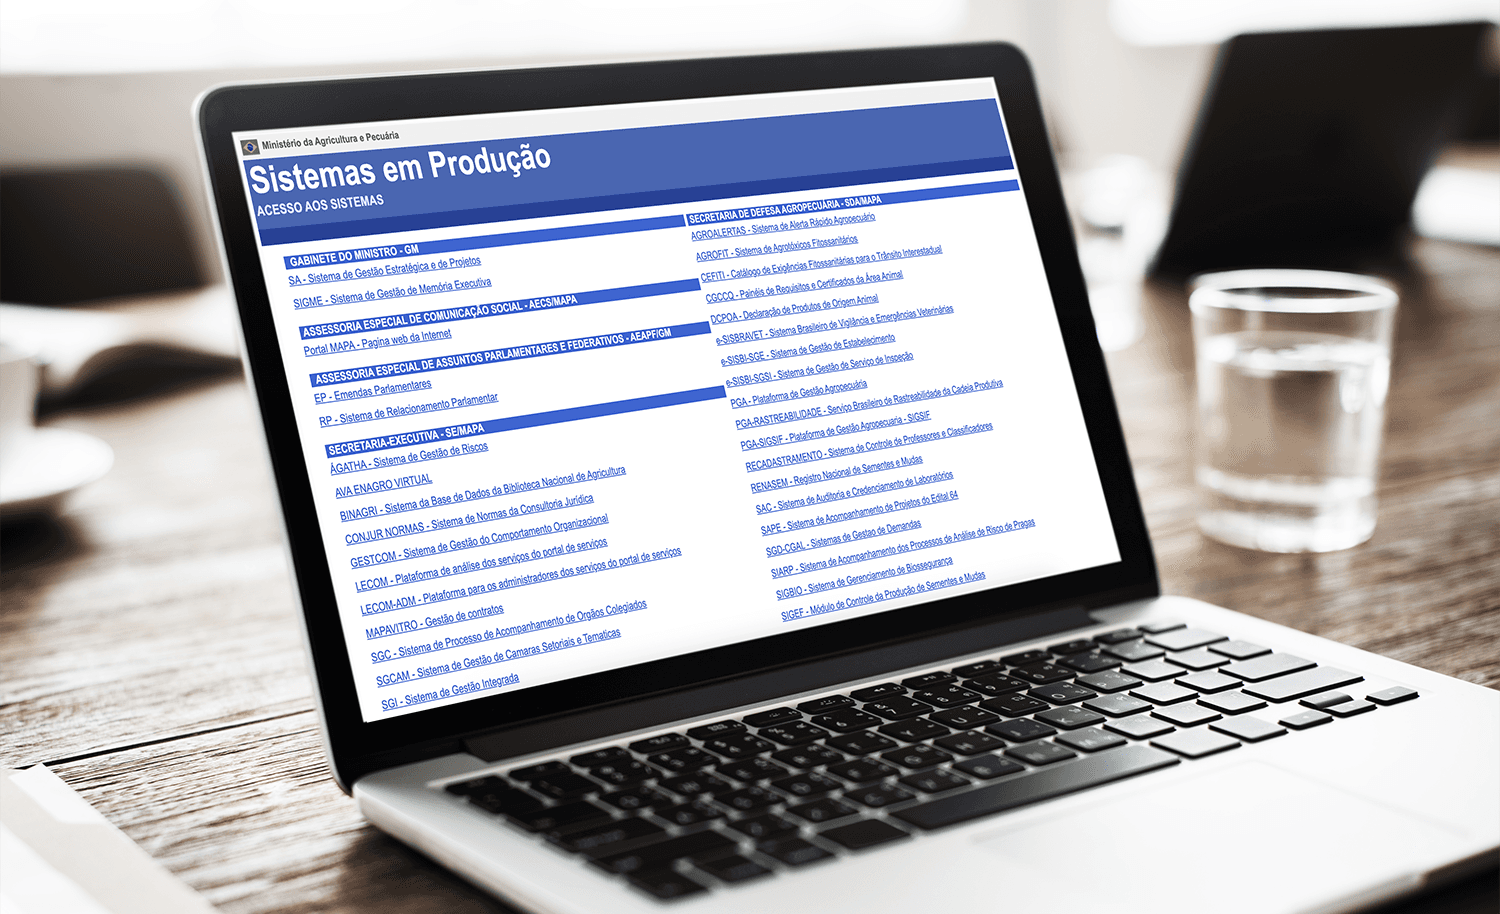
Previous interface featuring an uncategorized list with no search functionality and numerous inactive systems, even after the first iteration, which only reorganized the list alphabetically.
03 _ process
You can't categorize what you don't understand
Before making any design decisions, we first needed to understand what actually existed on the portal. We conducted interviews and workshops with department managers and directors across the Ministry, as they were the only people who truly knew which systems were still active, which had been discontinued, and how each department organized its day-to-day work.
The process was collaborative and iterative, with every system reviewed individually. Inactive systems were removed, and undocumented systems were identified and properly documented.
01
Discovery
Mapping existing systems through forms and meetings with department leaders.
02
Audit
System-by-system verification of status, broken links, and outdated contact information.
03
Collaborative categorization
Categories were defined collaboratively with each department, including Plant Production, Animal Production, Administration, IT, Budget, and others.
04
Prioritization
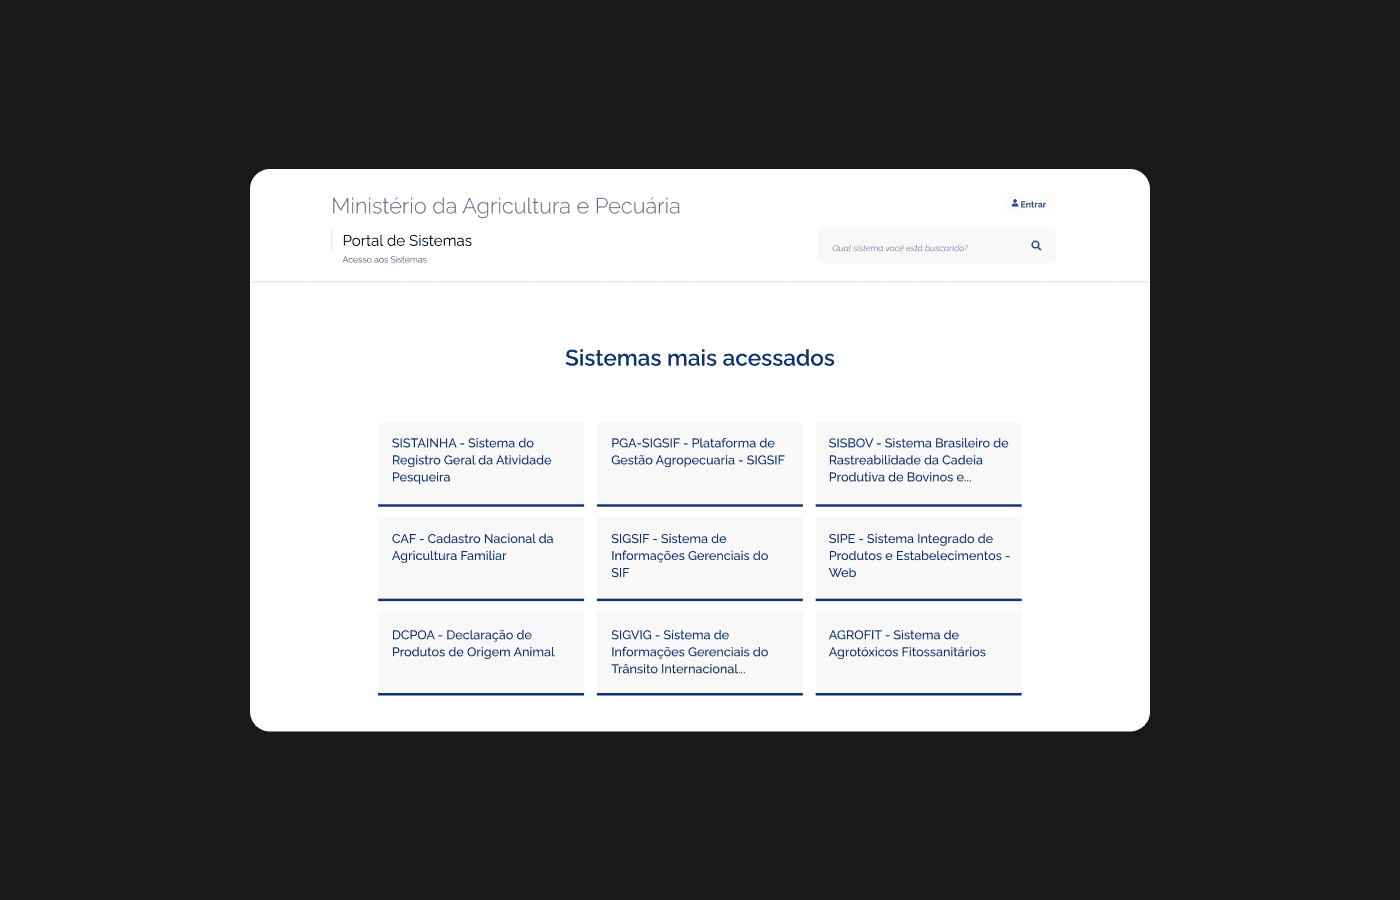
Created a “most accessed” section that is updated monthly using real user usage data.
04 _ solution
A system redesigned for every user
Every design decision was made to reduce user effort.
Category-based information architecture
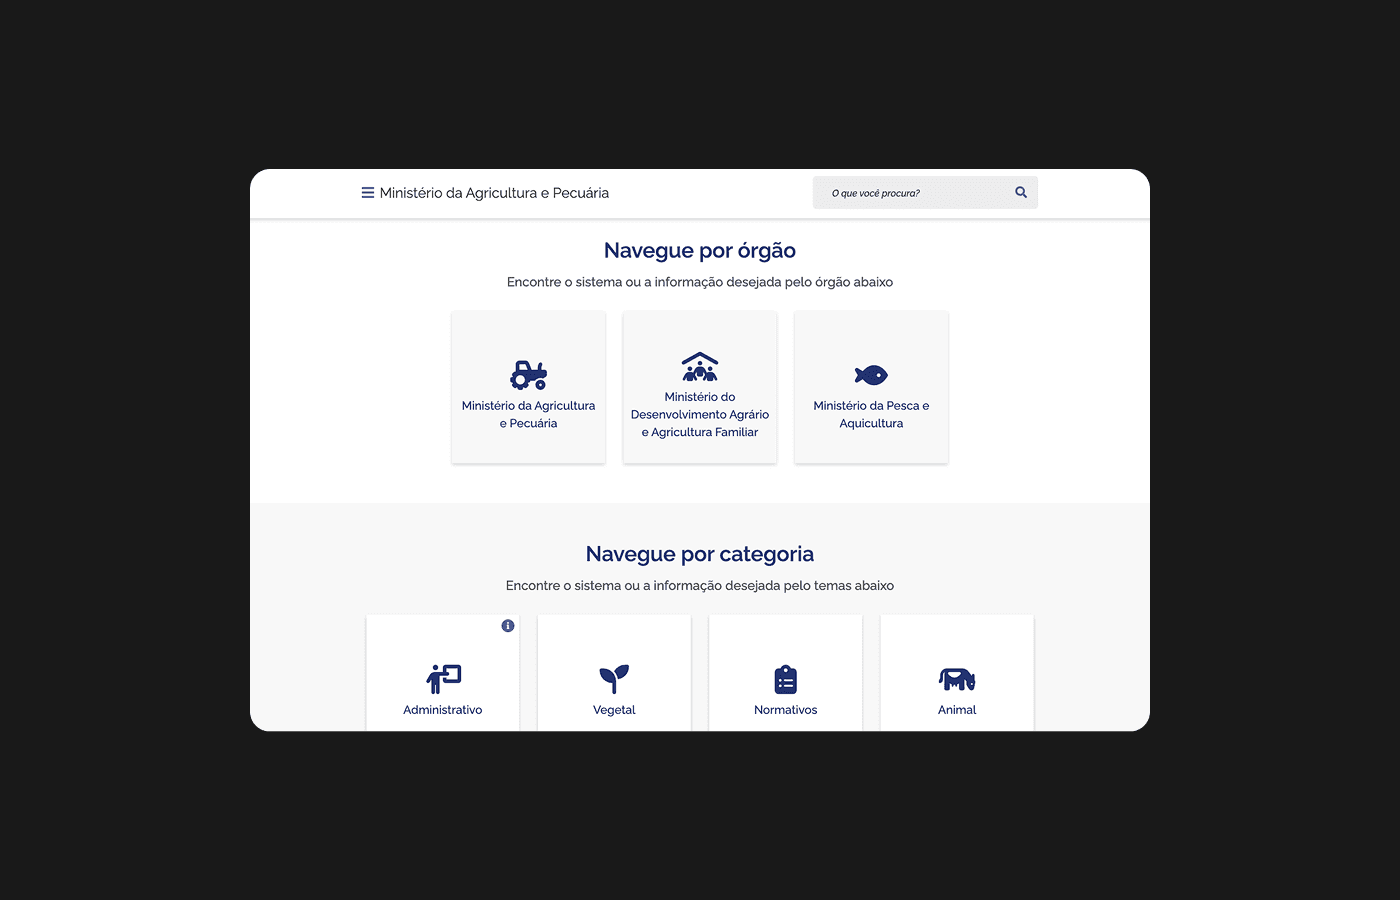
More than 100 systems were organized into eight thematic categories, defined collaboratively with teams from each department.
NIELSEN 06, RECOGNITION
Persistent search
For users who already know what they are looking for, search eliminates the need to rely on Ctrl+F (a shortcut not all users are familiar with) or prior knowledge of the portal's structure.
NIELSEN 07, EFFICIENCY
"Most accessed" section
A dynamic section designed to update monthly based on usage data, allowing the interface to adapt to seasonal demand (e.g., fishing-related systems becoming more prominent during the fishing season). The proposal was approved during the project but was not implemented in the final version.
NIELSEN 06, RECOGNITION
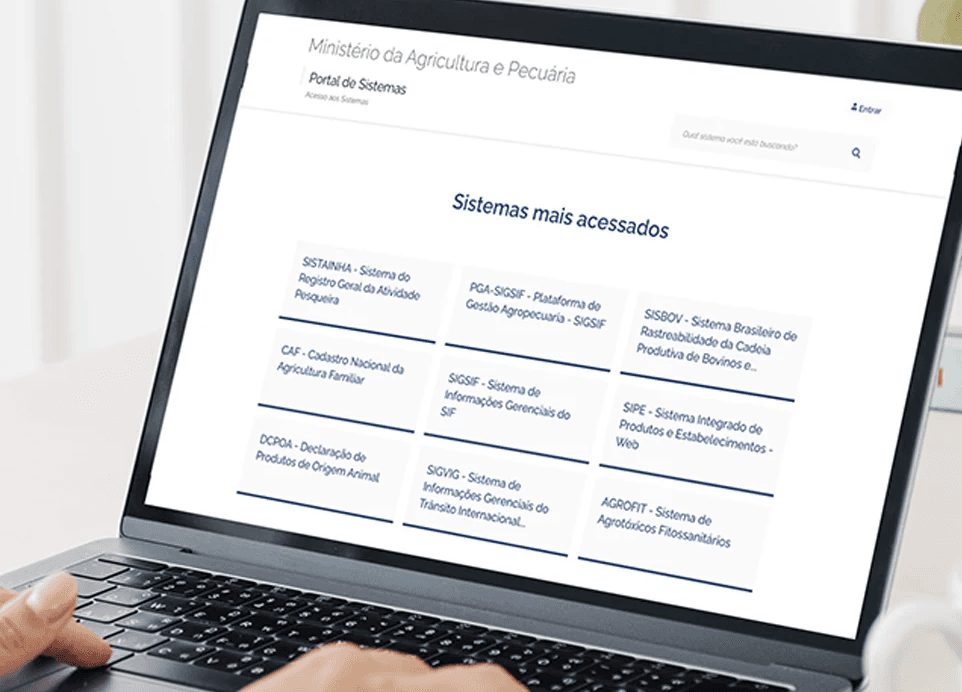
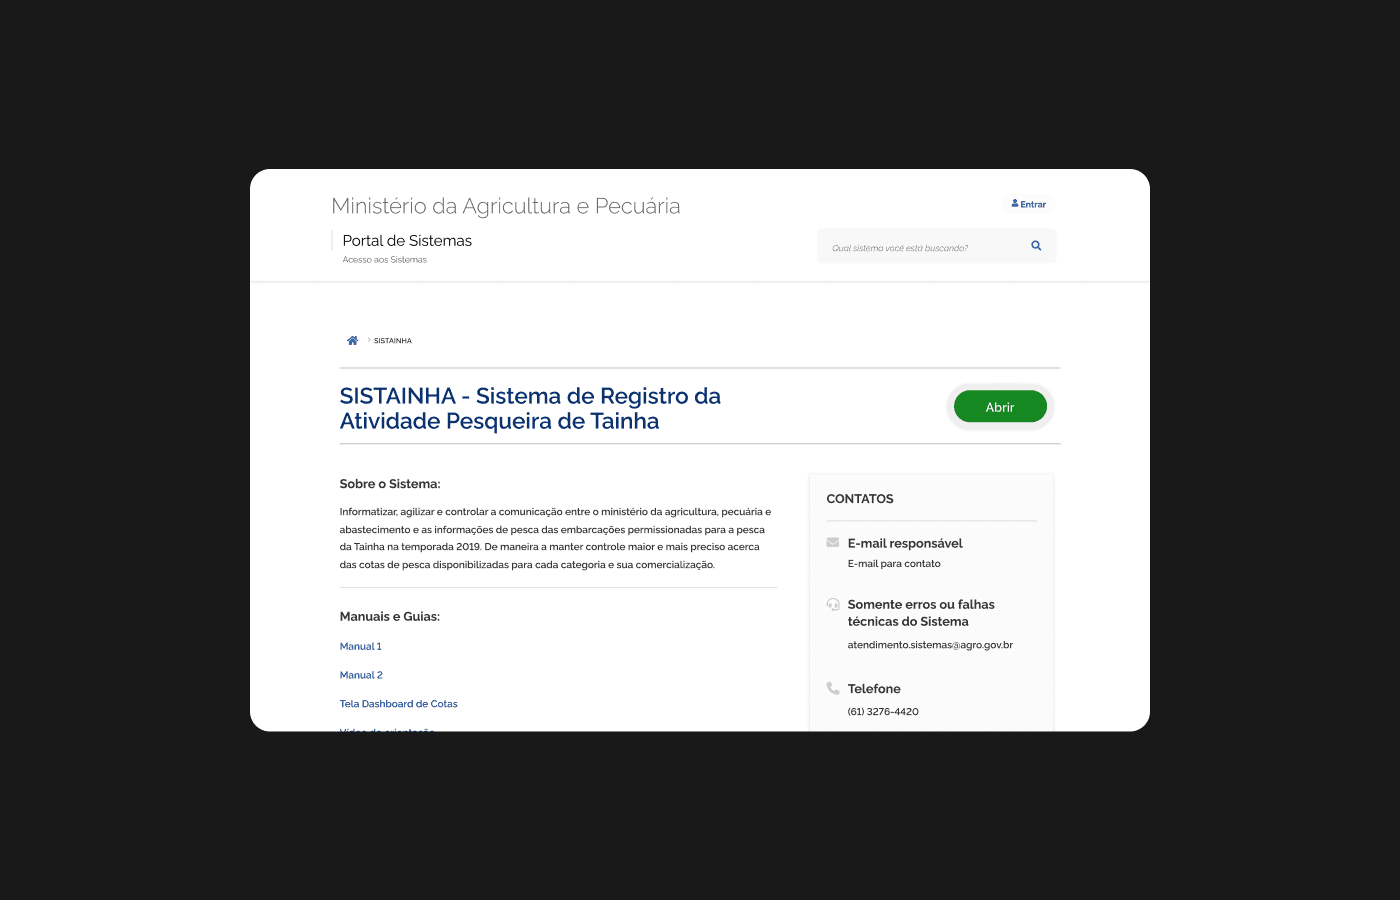
Updated interface featuring a category-based structure defined collaboratively with teams across the Ministry.
05 _ result
Finally, a portal that works!
The project's collaborative process aligned teams across the Ministry and established a maintenance workflow to ensure the portal remains accurate and continuously updated.
Reorganized and categorized into eight thematic groups.
Time saved
Users now find what they're looking for in less than a minute.
35% reduction
In access-related errors during the first quarter. (IT team's internal assessment)